My website scored 66 out of 100. Here is what I fixed.
mobile performance score, before and after the fixes
In short
PageSpeed gave my site 66 out of 100 on mobile. The main culprits were fonts loaded in full, the image at the top of the page loading in the queue with everything else, and a chat bubble that shifted the layout. After the fixes the site scores 92–99 depending on the run, and the layout does not jump at all.
Where the score came from
Under one of my posts, someone dropped a screenshot from PageSpeed Insights. It is a free Google tool: you enter a website address and after half a minute you see how fast it loads on a phone. My site got 66 out of 100.
I sell websites that are supposed to be fast, so that was awkward. All the more because anyone can check it themselves in half a minute, without any access to the site. Instead of making excuses, I sat down to fix it.
Results before and after
| What it measures | Before | After |
|---|---|---|
| Performance (out of 100) | 66 | 92–99 |
| LCP: when the largest element on screen appears | 4.8 s | 1.5–2.9 s |
| CLS: how much the layout jumps while loading | 0.238 | 0 |
Google considers an LCP under 2.5 seconds and a CLS under 0.1 to be good. CLS dropped to zero. LCP varies between runs and in some of them still goes over the limit. That is because of the video at the top of the page, which I write about below.
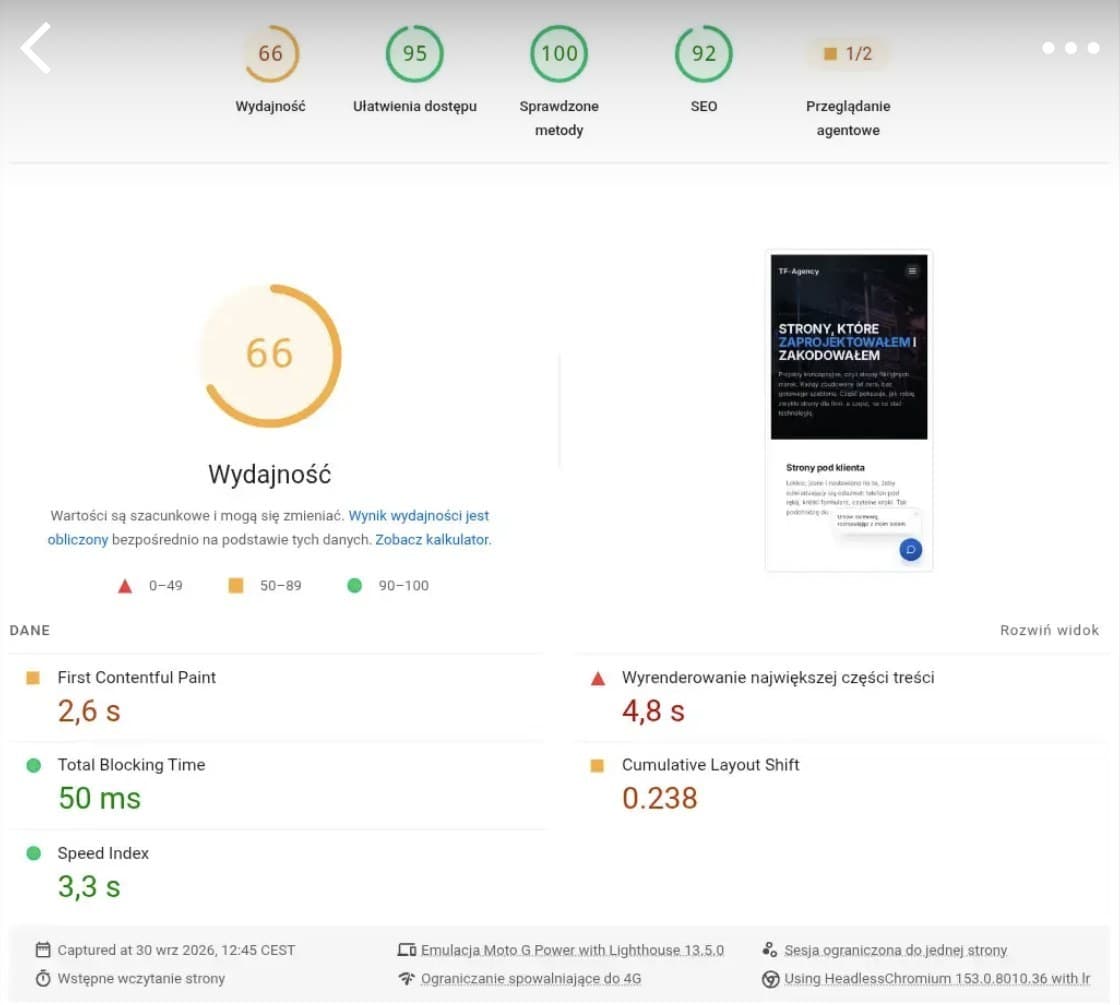
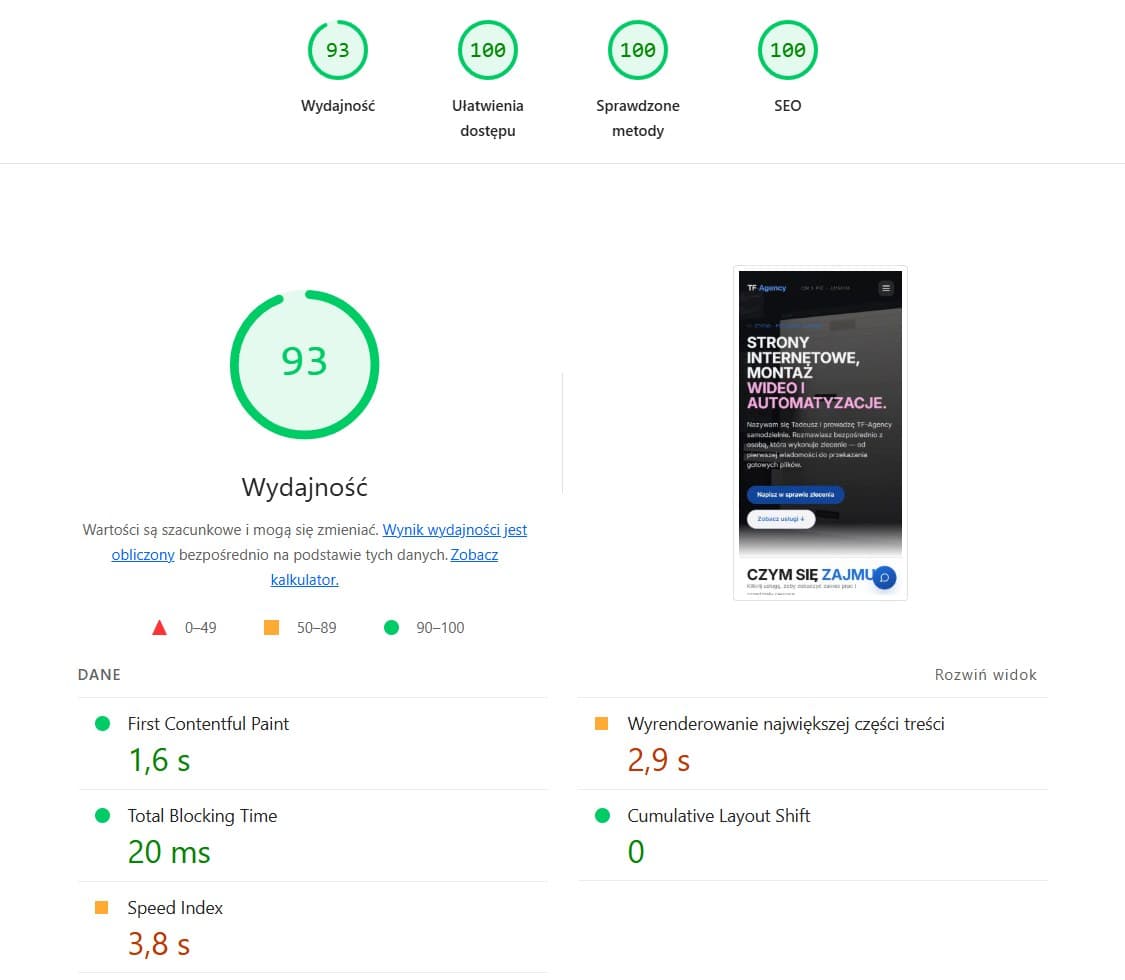
On the left, the screenshot from the comment; on the right, a measurement after the fixes. The score varies between runs, from 92 to 99 in my tests.
What was slowing the site down
- Fonts. I was loading three full font files, about 110 KB each, with characters from alphabets the site does not use at all. The phone had to download them before showing any text. Now it downloads only Latin letters with Polish characters, and a font used only further down the page no longer blocks the first screen.
- The image at the top of the page. The browser did not know it was the most important element and loaded it in the queue with everything else. Now it gets priority and a lighter format (AVIF).
- The chat bubble. It popped up by itself after two seconds and pushed the page layout around. That is where the 0.238 jump came from. Now it floats above the page, moves nothing and appears only after the first scroll.
- The title animation. The heading faded in from transparency, so for a moment it did not exist for Google. Now it slides in with motion only and is visible from the first frame.
- The video further down the page. A 1.4 MB file loaded straight away, although nobody was watching it yet. Now it downloads only when you get close to that section.
Why the background video stays
Without the video at the top, the site scored 95–100 in tests. With the video it scores 92–99. I checked both versions, and the still frame on its own looked flat, with no contrast. I kept the video: a few points lower, but the site looks the way it should, and the score still falls in the range Google considers good (90–100).
I do the same with client websites: I show both versions and the client decides what matters more to them.
What I do from now on
From now on I check every website, mine and clients', in PageSpeed before handover and once more after launch. The goal is at least 90 on mobile. If your current site loads slowly, write or call. I will tell you what is slowing it down.